Understanding the Aroon Indicator – Bitcoin (BTC) Example
- You must enroll in this course to access course content.
The Aroon Indicator is a popular trend-identifying tool that helps traders determine whether an asset is in an uptrend, downtrend, or range-bound phase. It consists of two lines — Aroon Up and Aroon Down — both moving between 0 and 100.
📊 What the Aroon Lines Represent
- Aroon Up (Blue or Green Line): Measures how recently a high occurred. Stays near 100 during strong uptrends.
- Aroon Down (Red or Orange Line): Measures how recently a low occurred. Stays near 100 during strong downtrends.
📈 Example: Bitcoin (BTC) Chart
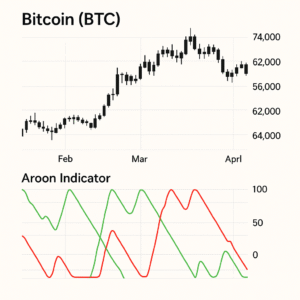
Below is an example of the Aroon indicator applied to the Bitcoin (BTC) price chart.
_price_.png)
💡 How to Interpret the Aroon Indicator
- 🔼 Aroon Up crosses above Aroon Down → Possible start of an uptrend.
- 🔽 Aroon Down crosses above Aroon Up → Possible start of a downtrend.
- ⚖️ Both near 50 → Sideways or consolidation market.
- 📈 Aroon Up near 100 & Down near 0 → Strong bullish momentum.
- 📉 Aroon Down near 100 & Up near 0 → Strong bearish momentum.
🎯 Key Takeaway
The Aroon Indicator is best used with other confirmation tools like the RSI or MACD. When used correctly, it helps traders anticipate the early stages of trend reversals or continuations in assets like Bitcoin.
✅ Course Summary
- Understand how Aroon Up and Aroon Down work
- Recognize bullish and bearish crossovers
- Apply the indicator on Bitcoin or other crypto charts
Course Information
Course Instructor

New Section
New Lesson
New Lesson
New Lesson